Your Failed Agent Run Burns Most of Its Tokens AFTER It Fails — Measure It in 40 Lines
Wasted tokens after agent failure are the part nobody meters. A clean agent run and a failed one cost about the same to start; the bill diverges after the run is already lost. This post measures that tail — the token fraction your run keeps burning past its first failure signal — with a 40-line offline meter.
AI disclosure: I drafted this with an AI writing assistant. The tool, both fixtures, and every number below come from a real local run of
waste_probe.pyon Python 3.13.5 with real tiktoken o200k_base. I ran, verified, and edited every line and number myself before publishing.
Here’s the number that made me write this. In a 2026 paper on multi-agent observability, researchers measured 165 GAIA traces and found that among warned failed runs, 58.1% of tokens are spent after the first warning signal, on average. First the warning fires (a tool error, a loop, a budget-pressure flag), and then the agent keeps going for more than half the run’s tokens before it stops. Read the citation carefully: that 58.1% is their number, on warned failed runs specifically, not all runs and not my measurement. I’ll keep those separated all the way down.
The point I want to land: waste is not failure. The failure is the cheap part. What’s expensive is the distance between “this run is clearly off the rails” and “the agent actually stopped.” That gap is denominated in tokens, and you can measure it on your own logs in about a minute.
TL;DR
- A failed agent run spends most of its tokens after the first detectable failure signal — the published figure is 58.1% on warned failed runs (arXiv 2606.01365, 165 GAIA traces).
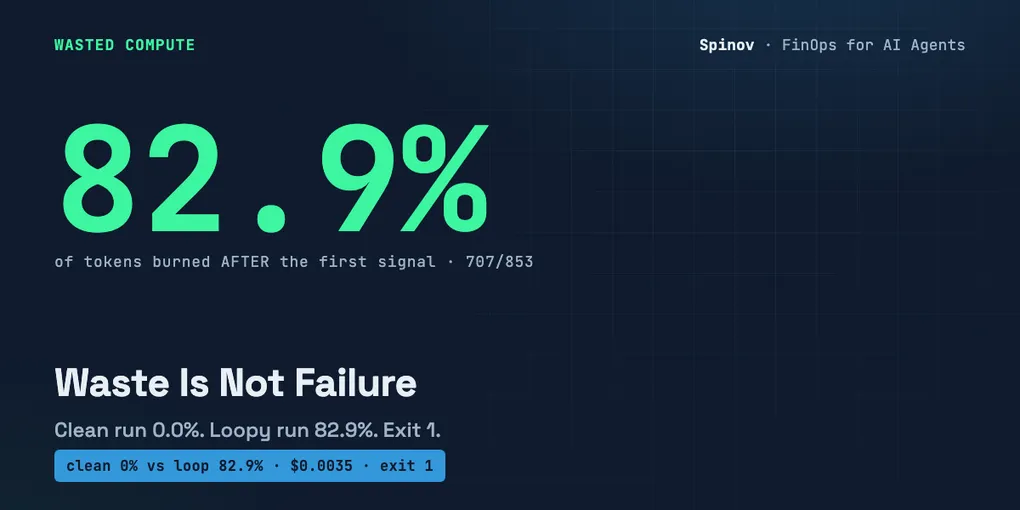
waste_probe.pyis a 40-line, offline, keyless, read-only script. Feed it a JSON trace; it finds the first signal and prints the token share burned at and after it.- On my own loopy fixture it measured 82.9% waste (707/853 tokens) — that’s my run on my fixture, a separate number from the paper’s.
- Exit code is a CI gate: 0 if waste ≤ threshold, 1 if over, 2 on usage error. Wire it onto collected traces.
- This is a post-mortem meter, not a runtime cap. It tells you where it burned; it does not block anything.
Where the wasted tokens after agent failure actually come from: first signal is not first stop
Think about what a failed run actually looks like in the log. It’s rarely one clean explosion. It’s a tool that returns a 200 OK with a slightly different JSON schema, a parser that throws KeyError: 'close', and an agent whose retry branch assumes flakiness — so it fires the exact same request again. And again. The payload never changes. The agent never reparses. It just loops, paying full freight on every turn, narrating its own confusion in increasingly confident prose.
By the time anything stops that run, the diagnostic information was available at the first error. Everything after it is re-derivation of a conclusion the trace already contained. That’s the waste. Not the failure itself, but the persistence past the failure.
I want to be precise about what this is and isn’t, because two adjacent ideas already have tools:
- It is not the re-bill tax. The context tax that re-bills your transcript every step is about the growing history being re-sent as input on every step — compounding, n(n+1)/2. That’s a cost you pay on a healthy run too. Waste-after-signal is different: it’s the excess work specific to the failure tail.
- It is not stale memory either. Dead-weight from a memory store — the kind you find when you audit your agent’s memory tax and backdoor — is retained-but-irrelevant context across runs. Waste-after-signal is within a single failed run, after a specific trigger.
- It is not a spend cap. A sliding-window spend guard that blocks the runaway loop at runtime stops execution when a dollar ceiling is hit.
waste_probe.pyblocks nothing. It reads a finished trace and reports a ratio. The gate it controls is your CI pipeline’s exit code, not the agent’s next call.
So the question it answers is narrow and falsifiable: in a given trace, what fraction of tokens landed at or after the first failure signal? If that fraction is reliably small on your real logs, this whole thesis is wrong for you, and the tool will say so with exit 0. I’d rather you find that out than take my word.
One more thing worth flagging, because it makes the tail bigger, not smaller: fan-out. Anthropic’s Dynamic Workflows (a research preview shipped late May 2026) let a run spawn tens to hundreds of parallel subagents, capped at 16 concurrent and 1,000 total per run. InfoQ’s writeup notes the obvious — these “can consume substantially more tokens than a typical session.” Now imagine the loop above, but forked across a dozen subagents that each missed the same schema change. The failure tail doesn’t add up. It multiplies.
The tool: waste_probe.py
The design constraints first, because they’re the reason you can actually run this on a production trace without a security review: offline, keyless, read-only, zero network. It reads one JSON file and prints. No vendor SDK, no API key, no telemetry leaving your machine. Tokenization is real (tiktoken with the o200k_base encoding), with an honest len/4 fallback if tiktoken isn’t installed; that fallback is roughly ±15% off true BPE, and it says so in the output.
The input is a trace: an ordered list of steps, each a small object.
[
  {"role": "assistant", "content": "I'll fetch the Q2 close...",
   "tool": "get_quote", "tool_args": {"symbol": "EXMPL", "period": "Q2"}, "status": "ok"},
  {"role": "tool", "content": "{...}", "tool": "get_quote", "status": "ok"}
]
The whole thing is 40 lines. Here’s the core — tokenization, signal detection, and the gate:
def step_text(s):
    return " ".join(str(s.get(k, "")) for k in ("role", "content", "tool", "tool_args", "status"))

def first_signal(steps):
    seen = set()
    for i, s in enumerate(steps):
        if str(s.get("status", "ok")).lower() == "error":
            return i, "tool-error"
        if "tool_args" in s:                         # only a CALL counts as a loop, not a tool result
            key = (str(s.get("tool", "")), json.dumps(s["tool_args"], sort_keys=True))
            if key in seen:
                return i, "repeat tool+args (loop)"
            seen.add(key)
    return None, "none"
Two signal types, and the earliest one wins:
status == "error"— an explicit tool error. The cheapest possible signal, and the one most logs already have.- A repeated identical
(tool, tool_args)pair — the agent called the same tool with byte-identical arguments it already tried. That’s a loop, or low-information-gain retry, and it’s a signal even when nothing errored.
That second check has a bug I hit on the first run, which is worth admitting because it’s a real trap. My first version keyed the loop on every step that had a tool field. But tool results (role: "tool") also carry a tool field, and two results from the same tool with no tool_args produced an identical empty key, firing a false loop on a perfectly clean trace. The fix is the if "tool_args" in s guard: only a call can be a loop, never a result. My clean fixture went from a wrong 45.4% to a correct 0.0% after that one line. Detection logic is exactly where these tools quietly lie to you, so I keep the fixtures adversarial.
Once it has the first signal index, the rest is arithmetic: sum the tokens at and after that index, divide by the total, convert to dollars at a configurable rate (the default $5/1M is a placeholder you override with --price-per-1m, not a vendor quote), and set the exit code against a threshold (default 0.30).
The real run
I ran this live on Python 3.13.5 with real tiktoken o200k_base. Two fixtures: a clean linear run, and a loopy one where the agent retries an identical failing call seven times. Verbatim output, nothing edited:
$ python3 waste_probe.py trace_clean.json
trace: trace_clean.json  (tiktoken o200k_base (exact))
steps: 8   total tokens: 326
token curve: 37 54 38 49 38 44 10 56
first signal: none - clean run
waste_after_signal: 0.0%  (0/326 tokens)
$ wasted after signal: $0.000000  (at $5.0/1M tok)
gate: PASS (threshold 0.30)  exit=0

$ python3 waste_probe.py trace_loopy.json
trace: trace_loopy.json  (tiktoken o200k_base (exact))
steps: 14   total tokens: 853
token curve: 37 58 51 77 51 74 51 72 51 78 51 79 51 72
first signal: step 3 (tool-error)
waste_after_signal: 82.9%  (707/853 tokens)
$ wasted after signal: $0.003535  (at $5.0/1M tok)
gate: FAIL (threshold 0.30)  exit=1
Read that loopy curve left to right. The run climbs normally (37 58 51 77), then at step 3 the first tool-error fires. After that, look at the rhythm: 51 74 51 72 51 78 51 79 51 72. The agent reissues the identical request, gets back the identical 200-OK payload it can’t parse, narrates a fresh theory about why it’ll work next time, and repeats. Five more round trips of pure re-derivation. 707 of 853 tokens, 82.9%, landed after the first signal.
That 82.9% is my number, on my fixture. It is not the paper’s 58.1%. The paper measured real GAIA traces across many runs and reported an average; I built one deliberately loopy trace to show the mechanism cleanly, and a single contrived trace will sit higher than a population average. Same phenomenon, two completely different denominators. If I ever quote one as the other, call me on it.
A note on the dollar figure: $0.003535 is tiny because the fixture is tiny. It scales linearly with token count and with whatever real rate you pass. The ratio is the durable signal; the dollars just put it in units a finance person reads. Run it at your own rate:
$ python3 waste_probe.py trace_loopy.json --price-per-1m=15.0
$ wasted after signal: $0.010605  (at $15.0/1M tok)
And the gate is real. No args returns exit 2; clean returns 0; loopy returns 1 — so a CI job can branch on it. The output is deterministic, too: I hashed the loopy run twice and got identical sha256 both times. No clock, no randomness, no network. Same trace in, same number out, every time — which is the only way a CI gate is worth having.
What to do with it on Monday
Three uses, in rough order of effort.
1. Measure your own ratio first. Take one real failed trace you already have — convert it to the [{role, content, tool, tool_args, status}] shape, run the probe, and read the percentage. Don’t assume it’s 58% and don’t assume it’s 83%. Measure yours. The whole reason this tool is keyless and offline is so you can do that on a real production log without asking anyone’s permission — the same measure-first habit behind metering your MCP server’s per-tool token tax before you cut anything.
2. Wire it as a CI gate on collected traces. If you save agent traces (and for anything in production you should), drop waste_probe.py into the pipeline that ingests them. exit 1 means “this run burned more than 30% of its tokens after it had already failed” — which is a regression worth a red build. Tune --threshold to your reality; 0.30 is a starting line, not a law. I picked it deliberately, and here’s why.
3. Close the loop toward early stopping. The same paper that gave us 58.1% ran a small pilot where acting on the early warning cut the post-warning token fraction from 0.638 down to 0.304. That’s the entire game in one before/after: detect the signal, stop near it, and the tail collapses. The probe is the measurement half. The other half is your agent’s retry logic actually treating a repeated-identical-call as terminal instead of transient — which, going back to the loopy fixture, is exactly the bug the agent never fixed about itself.
What this is not
Honesty about the edges, because the tool is small on purpose:
- Not a runtime blocker. It reads finished traces. It will not stop a burning run mid-flight — that’s a spend cap’s job.
- Not a detector of all waste. It catches two signals: explicit tool errors and byte-identical repeated calls. A semantically pointless-but-textually-different retry slips right past it. So does a wrong-but-confident answer with no error at all. The repeated-call check is exact-match by design — it’s high-precision and deliberately low-recall.
- Not a substitute for an eval. A waste ratio tells you how much burned after the signal, never whether the final answer was correct. You still need both.
- The threshold is a guess until you calibrate it.
0.30echoes the paper’s post-intervention0.304, which is a nice coincidence and nothing more. Your number is your number.
The thesis, one more time, falsifiable: in a failed run, the expensive tokens come after the first detectable signal, not before. The published average on warned failed runs is 58.1%. My loopy fixture hit 82.9%. Now go get yours — and if it comes back consistently under 30%, you’ve got a healthier stop condition than most, and I’d genuinely like to hear how you built it.
Which signal trips first on your traces — the error or the loop? And what finally makes your agent treat a repeated identical call as terminal instead of transient? Drop it in the comments; that retry-is-terminal question is the one I’m still chewing on.
Written by Alexey Spinov. The tool, both fixtures, and the verbatim run output are included with this post — clone, run, and check the numbers against your own logs. Disclosure: I drafted this with AI assistance and ran, verified, and edited every line and number myself; the live output above is from my own machine.