Measure Your MCP Server's Token Tax in 60 Seconds
The MCP server token tax is the context budget every tool definition eats before your agent does a single useful thing. To measure it, pull the server’s tools/list JSON and tokenize each definition. Claude Code’s Tool Search defers loading — it doesn’t reduce the tax. Run the 60-second audit below and you’ll see your real per-tool cost instead of repeating someone else’s number.
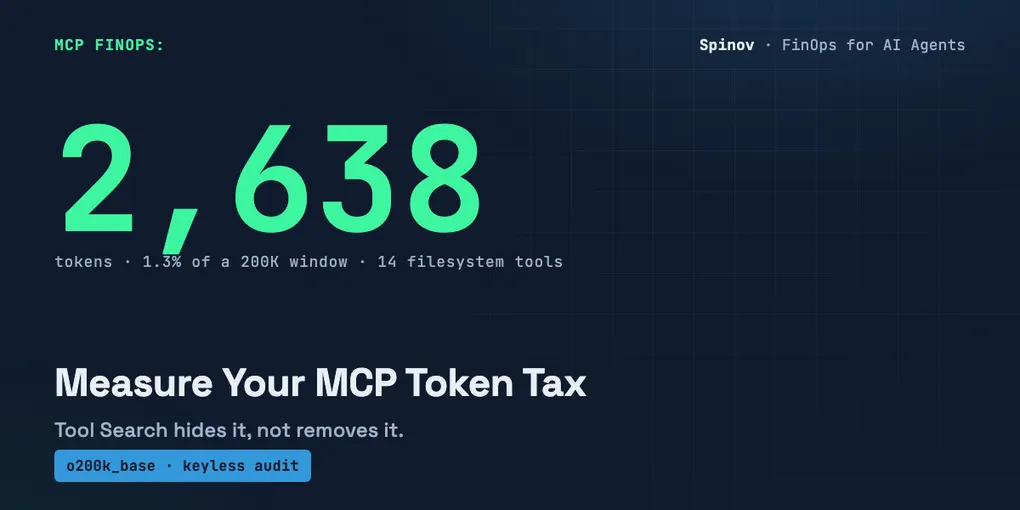
In short: the MCP server token tax is the context budget every tool definition eats before your agent does anything. To measure it, pull the server’s tools/list and tokenize each definition with tiktoken. My run of the real filesystem server: 14 tools, 2,638 tokens, ~1.3% of a 200K window.
AI disclosure: I wrote
mcp_token_tax.pywith AI assistance and ran it myself before publishing. Every number below is pasted from a real run of that script, or it’s an external figure with a dated link next to it. I label which is which.
You’ve seen the figure quoted everywhere this spring: “the GitHub MCP server costs you tens of thousands of tokens before you ask anything.” It gets repeated in threads, in newsletters, in conference hallway chatter. Here’s a question almost nobody answers when they quote it: with which tokenizer, against which tools/list?
I didn’t want to repeat a number. I wanted to measure one. So I drove the real, published filesystem MCP server, captured its actual tools/list, and counted. The answer surprised me, and it’s the reason this post exists.
TL;DR
- The token tax is the cost of tool definitions sitting in your context, paid on (nearly) every turn, before any work happens.
- I measured the real
@modelcontextprotocol/server-filesystemserver: 14 tools, 2,638 tokens, ~1.3% of a 200K window. One server is small. That’s the honest part most “context bloat” posts skip. - It compounds. Anthropic’s own numbers put a 5-server setup at ~55K tokens, and 134K “before optimization” internally (Anthropic, Nov 2025). The tax is real — it just lives in the sum, not in any one server.
- Tool Search hides the tax behind lazy loading; it doesn’t delete it. When a tool actually runs, its definition still enters context. You still want to know which tools are expensive.
- The script is keyless, read-only, deterministic on a saved fixture, stdlib +
tiktoken. Copy it, run it, audit your own stack.
This is the first post in a small thread on MCP FinOps: measure before you cut. It sits next to the control side of my work: a hard spend-cap that stops a runaway agent loop and the pre-execution gate that refuses a bad agent action before it runs. Those stop bad actions. This one just gives you a number, because you can’t cut what you haven’t measured.
What exactly is the token tax?
A tool definition is text. Name, title, a human-readable description, the JSON Schema for its inputs (and now, often, an output schema and annotations). When you connect an MCP server, the host serializes all of that and injects it into the model’s context so it knows the tool exists and how to call it.
That text doesn’t get charged once. It rides along on turn after turn, because the model has to keep “seeing” the tools to use them. Ten tools you never call still sit in the window, quietly, on every request. That’s the tax: rent on capability you’ve declared but may not be using.
Two costs come out of it. The obvious one is dollars: input tokens you pay for repeatedly. The sneakier one is room. Every token of definition is a token not available for the actual conversation, the retrieved docs, the file you pasted. The MCP spec is moving toward a stateless core in the 2026-07-28 release candidate, which reshapes a lot — but it doesn’t change the basic physics here. Definitions still have to reach the model somehow.
Ken Alger named the downstream symptom plainly in his March 2026 piece on multi-agent MCP: “A single agent juggling too many tools often suffers from… Tool Confusion: choosing the wrong function when multiple tools are available,” plus “Latency and Cost.” Tokens are one face of that. Accuracy is the other. Anthropic’s own testing in that same November post showed a model’s tool-selection accuracy climbing from 49% to 74% once it stopped carrying every definition at once. Fewer tools in context, better choices. The tax isn’t only financial.
The tool: run it on your own server now
Here’s the whole thing. It does one job: read a tools/list, tokenize each tool with tiktoken’s o200k_base encoding (the gpt-4o family encoding — swap in cl100k_base for older models), and print a per-tool table with the share of your context window and a dollars-per-round estimate.
You feed it tools two ways. Point it at a published stdio server and it’ll do the JSON-RPC handshake and capture the real tools/list live — keyless, read-only, and it never calls tools/call, so nothing executes. Or hand it a JSON fixture you saved earlier, for a deterministic run that reproduces byte-for-byte.
#!/usr/bin/env python3
"""mcp_token_tax.py - measure the token tax of an MCP server's tool definitions."""
import argparse, json, subprocess, sys, threading
try:
    import tiktoken
except ImportError:
    sys.exit("tiktoken is required:  pip install tiktoken")

def serialize_tool(tool: dict) -> str:
    # The text a host puts in context for one tool, as compact JSON.
    # Hosts frame this differently, so it's a close approximation, not a
    # provider's billing meter. Counted the same way for every tool, so the
    # ranking and relative shares hold even where the absolute number drifts.
    return json.dumps(tool, ensure_ascii=False, separators=(",", ":"))

def measure(tools, encoding_name="o200k_base"):
    enc = tiktoken.get_encoding(encoding_name)
    rows = []
    for t in tools:
        rows.append({
            "name": t.get("name", "<unnamed>"),
            "tokens": len(enc.encode(serialize_tool(t))),
            "n_params": len((t.get("inputSchema") or {}).get("properties", {})),
        })
    rows.sort(key=lambda r: r["tokens"], reverse=True)
    return rows

def from_fixture(path):
    data = json.load(open(path, encoding="utf-8"))
    return data.get("serverInfo", {}), data["tools"]

def from_server(server_cmd, timeout=90):
    proc = subprocess.Popen(server_cmd.split(), stdin=subprocess.PIPE,
        stdout=subprocess.PIPE, stderr=subprocess.PIPE, text=True, bufsize=1)
    def send(o): proc.stdin.write(json.dumps(o) + "\n"); proc.stdin.flush()
    def read_id(tid, budget=60):
        for _ in range(80):
            box = {}
            th = threading.Thread(target=lambda: box.update(line=proc.stdout.readline()),
                                  daemon=True)
            th.start(); th.join(budget)
            line = box.get("line", "")
            if not line: continue
            try: msg = json.loads(line)
            except json.JSONDecodeError: continue
            if msg.get("id") == tid: return msg
        return None
    send({"jsonrpc":"2.0","id":1,"method":"initialize","params":{
        "protocolVersion":"2025-06-18","capabilities":{},
        "clientInfo":{"name":"mcp-token-tax","version":"0.1"}}})
    init = read_id(1, timeout)
    send({"jsonrpc":"2.0","method":"notifications/initialized","params":{}})
    send({"jsonrpc":"2.0","id":2,"method":"tools/list","params":{}})
    listed = read_id(2, timeout)
    proc.terminate()
    if listed is None:
        sys.exit("Could not get tools/list. " + (proc.stderr.read() or "")[:500])
    return (init or {}).get("result", {}).get("serverInfo", {}), listed["result"]["tools"]

def report(server, rows, ctx, price):
    total = sum(r["tokens"] for r in rows)
    print(f"MCP token tax  -  {server.get('name','?')} v{server.get('version','?')}")
    print(f"encoding: o200k_base (gpt-4o family)  |  {len(rows)} tools\n")
    print(f"{'tool':<28}{'tokens':>8}{'% toolset':>11}{'params':>8}")
    print("-" * 55)
    for r in rows:
        print(f"{r['name']:<28}{r['tokens']:>8}{r['tokens']/total*100:>10.1f}%{r['n_params']:>8}")
    print("-" * 55)
    print(f"{'TOTAL':<28}{total:>8}{'100.0%':>11}\n")
    print("Context budget burned before the first prompt:")
    print(f"  total definition tokens : {total:,}")
    print(f"  share of a {ctx:,}-token window : {total/ctx*100:.1f}%")
    print(f"  est. cost per round @ ${price:.2f}/1M input : ${total/1_000_000*price:.4f}")

def main():
    ap = argparse.ArgumentParser()
    g = ap.add_mutually_exclusive_group(required=True)
    g.add_argument("--fixture"); g.add_argument("--server")
    ap.add_argument("--ctx", type=int, default=200_000)
    ap.add_argument("--price", type=float, default=3.00)
    a = ap.parse_args()
    server, tools = (from_fixture(a.fixture) if a.fixture else from_server(a.server))
    report(server, measure(tools), a.ctx, a.price)

if __name__ == "__main__":
    main()
Two ways to run it. Live against the real npm package:
pip install tiktoken
python3 mcp_token_tax.py \
  --server "npx -y @modelcontextprotocol/server-filesystem@latest /tmp"
Or against a tools/list you’ve already saved (deterministic):
python3 mcp_token_tax.py --fixture filesystem_toolslist.json --price 3.00I ran the live and the fixture paths side by side; for the same captured version they produce identical token counts, which is the point. The fixture is captured real output, not a guess. One caveat: @latest is a moving target — when the package ships new descriptions or schema fields, the live count will drift from the fixture. Pin a version (@2025...) if you need a number you can diff next month.
What the numbers actually say
Here’s the verbatim run against the real @modelcontextprotocol/server-filesystem (server reports itself as secure-filesystem-server v0.2.0), captured today:
MCP token tax  -  secure-filesystem-server v0.2.0
encoding: o200k_base (gpt-4o family)  |  14 tools

tool                          tokens  % toolset  params
-------------------------------------------------------
read_text_file                   250       9.5%       3
edit_file                        239       9.1%       3
search_files                     212       8.0%       3
read_multiple_files              204       7.7%       1
directory_tree                   196       7.4%       2
list_directory_with_sizes        195       7.4%       2
move_file                        186       7.1%       2
read_media_file                  185       7.0%       1
read_file                        173       6.6%       3
create_directory                 171       6.5%       1
write_file                       168       6.4%       2
list_directory                   160       6.1%       1
get_file_info                    156       5.9%       1
list_allowed_directories         143       5.4%       0
-------------------------------------------------------
TOTAL                           2638     100.0%

Context budget burned before the first prompt:
  total definition tokens : 2,638
  share of a 200,000-token window : 1.3%
  est. cost per round @ $3.00/1M input : $0.0079
  heaviest tool           : read_text_file (250 tok, 9.5%)
  lightest tool           : list_allowed_directories (143 tok)
Two units honesty before you quote that 1.3% at me. I count with o200k_base, the gpt-4o tokenizer — Claude ships no public tokenizer, so on a Claude 200K window this is a proxy, and the real Claude-token figure will differ a little. And I count the whole tool object as compact JSON; a host that injects only name/description/inputSchema would see closer to ~1,640 tokens here, while the same objects pretty-printed run ~4,036. So the honest band for “what reaches the model” is roughly 1.6K–4K, and 2,638 is my single defensible point inside it, counted identically for every tool. The ranking and the shares below are rock-solid; treat the absolute total as an order-of-magnitude, not a meter.
Now the honest part. 2,638 tokens. 1.3% of a 200K window. For one server, that is not scary. If you came here expecting me to confirm that any single MCP server is a five-alarm fire, I can’t — not this one. The filesystem server is lean: fourteen tools, terse descriptions, simple schemas. Its single most expensive tool, read_text_file, costs 250 tokens, mostly because its description spells out the head/tail behavior in prose.
So where does the panic come from? Two places, and both are real.
First, verbose text drives the cost — prose and schema both, not the raw parameter count. Compare read_text_file (250 tokens, a long head/tail description) with list_allowed_directories (143 tokens, almost no prose and zero params). But don’t over-credit descriptions alone: across these 14 tools, token count tracks the size of the input schema (correlation ~0.80) more tightly than the length of the description (~0.36). edit_file proves it — a short description but a fat nested edits schema lands it at 239 tokens, second-heaviest in the table. So the rule isn’t “watch your prose,” it’s “watch your total surface area”: paragraph descriptions and sprawling schemas with big enum lists both bill. Servers that ship both pay a tax this lean reference server doesn’t. That’s why the heavy ones in the wild, GitHub and Slack, clock in an order of magnitude higher.
Second, it compounds. One server at 1.3% is nothing. Now stack the real ones. Anthropic published actual measurements in November 2025: GitHub ~26K tokens, Slack ~21K, and a five-server setup of 58 tools landing at “approximately 55K tokens before the conversation even starts,” with 134K “before optimization” on their internal deployment (Anthropic engineering, 2025-11-24). Those are their numbers, measured by them — I’m quoting, not claiming. But the shape is exactly what my run predicts in miniature: a single lean server is cheap, ten chatty servers are a tax bracket.
For the FinOps-minded: the dollar line is the ROI hook. At $3/1M input tokens, one filesystem server costs $0.0079 a round. Trivial. But run it at the per-turn frequency of an agent loop across a 55K-token multi-server stack, and you’re paying for 55K tokens of overhead on every single call, forever, whether or not the model touches those tools. That’s the math worth checking against your own bill. Plug your real --price and --ctx in and read the bottom line.
Why Tool Search hides the tax instead of removing it
Claude Code shipped Tool Search, and it’s genuinely good. When your tool definitions would exceed roughly 10% of the context window, it stops loading all of them up front; it keeps a lightweight index and pulls the full definition for a tool only when the model decides it needs it. Anthropic reports about an 85% reduction in tokens carried with the full library still reachable. Real win. Use it.
But notice the verb. It defers loading. It doesn’t delete the definition. When the model actually reaches for create_or_update_file, that tool’s full schema enters context at that moment — you pay the tax then, plus the cost of the search step that found it. The total bill for tools you use is roughly the same; what changes is you stop paying for the 50 tools you don’t use this turn.
That’s why “we enabled Tool Search, we’re done” is the trap. Lazy loading is a great default. It is not a measurement, and it is not a decision. It quietly amortizes a cost you never looked at. My contrarian line, and I’ll happily be wrong in the comments: tracking the tax away is not controlling it. The control move is to open the table above, find your read_text_file — the one fat tool whose description you can halve, or the four near-duplicate read tools you can collapse into one — and cut. Tool Search makes the bloat invisible. The audit makes it editable. Measure first, then cut, then let lazy loading handle what’s left.
What this is NOT
I’d rather you trust the small honest number than oversell it.
- It’s not a billing meter, and the drift is one-directional, not a tidy ±.
serialize_toolcounts the whole raw tool object — includingoutputSchema,annotations, andexecution— as compact JSON. Two honest biases ride along. Those extra fields are ~38% of the total here, and a host that only sendsname/description/inputSchemato the model wouldn’t pay for them (that’s the ~1,640 core I mentioned above). Meanwhile compact JSON has zero whitespace, so it under-counts versus a pretty-printed schema (~4,036). Net: the absolute number can swing well past ±15% in either direction depending on how your host frames things — it is not a symmetric error bar. What stays solid is that every tool is counted the same way, so the ranking and the relative shares hold. Treat it as a tape measure, not a cash register. - It only counts definitions, not calls. This is the static cost of declaring tools. The tokens a tool spends when it actually runs (arguments in, results back) are a separate, often much larger story this script doesn’t touch — and a call that returns cleanly isn’t proof it did the work, which is a why your agent returns 200 and lies problem, not a token one.
- It’s not a tool-quality benchmark. A 250-token tool isn’t “worse” than a 143-token one.
read_text_fileearns its tokens with a description that prevents misuse. Sometimes the verbose tool is the correct one. The number tells you the cost, not whether it’s worth paying. - One server proves little; your stack proves everything. I measured a deliberately lean reference server precisely so I couldn’t cherry-pick a scary total. Run it on your combination. That’s the whole point.
Run it on the server you actually use
Pick the heaviest MCP server in your config, the one with 40-plus tools and paragraph descriptions, and run the audit against it. I’d bet the cost is wildly uneven: a handful of tools eating a third of the budget while the rest are rounding errors. That asymmetry is where the cut lives.
So here’s the real open question I keep hitting and haven’t solved cleanly: at what point is collapsing five granular tools into one fat, well-described tool a net win — fewer definitions in context, but a longer single description and more tool-confusion risk inside it? I have hunches, not a rule. If you’ve measured both sides of that trade on a real server, drop the numbers in the comments — I read every one. And follow along; the next post in this thread takes the audit to a full multi-server stack and tries to find that break-even.