Prompt Cache Break: Hit-Rate Fell 100% to 40% in 40 Lines
In short: a prompt cache-break is when one change atop your prompt prefix — a fresh timestamp, a reordered tool block — makes the cache miss from there down, so cached reads silently re-bill as fresh input. cache_break.py hashes each prefix segment, localizes the break, and fails CI. On my fixture, one timestamp dropped the estimated cache-hit-rate 100% to 40%.
AI disclosure: I drafted this with an AI writing assistant. The tool, the two fixtures, and every number below come from a real local run on tiktoken o200k_base — I ran it, checked the exit codes, hashed the output twice to confirm it’s deterministic, and edited every line before publishing.
Turning on prompt caching feels like a free win. It usually isn’t the win you think.
Here’s the trap. Anthropic and OpenAI both price a cache read at a fraction of a fresh input token — Anthropic quotes cached reads at roughly $0.30/M vs $3.00/M for fresh, about a 10x gap on the cached portion (Anthropic prompt caching docs). Flip the feature on, watch the dashboard, move on. But that discount is only paid for a prefix that is byte-for-byte identical to what’s already cached. Change one character near the top and the cache misses from there down. You still have caching on. You’re just not hitting it. And nothing in your config screams about it.
So the number that actually matters isn’t “is caching enabled.” It’s your real cache-hit-rate — and almost nobody meters it.
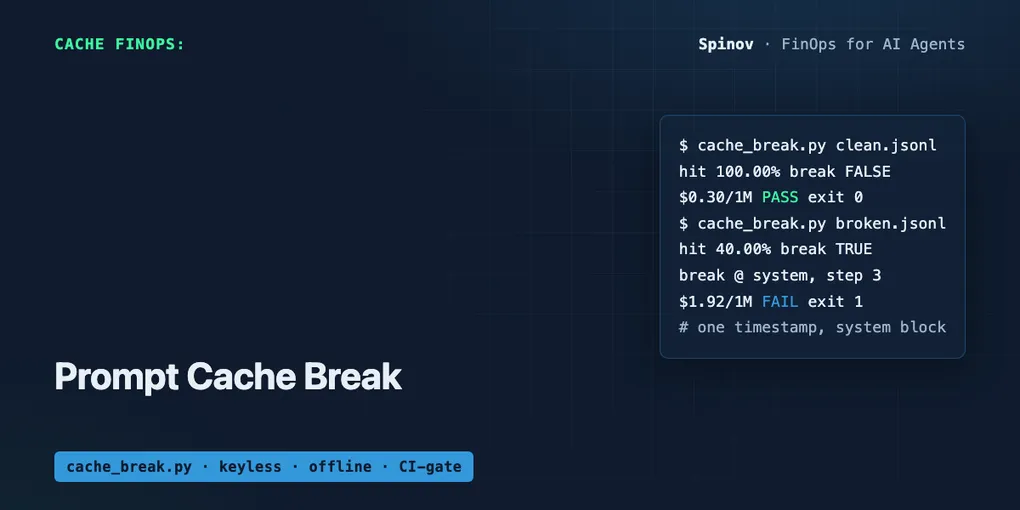
TL;DR. Prompt caching only pays out on an exact-prefix match. Agents quietly break that match: a dynamic now=... in the system block, two tool definitions that got reordered, a memory snippet inserted at the top. When the prefix breaks, the cache misses below the break and re-bills it as fresh input. cache_break.py (below, keyless, offline) hashes each prefix segment per step, localizes the first one that diverges from the baseline, computes the hit-rate, and gates it. On a clean trace it estimated 100% hit-rate, exit 0. On the same content with one injected timestamp, 40%, cache-break flagged at segment 0 step 3, exit 1.
The contrarian bit: “caching is on” is not “caching is working”
Most caching write-ups stop at how to turn it on. Mark the prefix, set cache_control, done. That’s the easy 80%. The expensive 20% is everything that silently invalidates the match afterward, on a running agent, where you’ll never notice from the totals.
Three ways an agent breaks its own cache without anyone touching the config:
- A dynamic value in the system prompt. The classic is a current timestamp —
now=2026-06-21T08:14:03Z— stamped into the system block so the model “knows the time.” It changes every call. It sits at the very top. So the cache misses on everything, every step, forever. - Reordered tool definitions. Your framework serializes tool schemas from a dict or a set. Run two, the order flips, the bytes differ, the prefix no longer matches. Same tools. Broken cache.
- A memory snippet inserted at the front. Retrieval-augmented memory that prepends “what we learned last session” pushes a variable block above the stable one. Everything below it is now fresh.
The falsifiable claim: if you take a clean trace and a byte-identical-content trace where only the prefix ordering breaks, a real measurement should show the hit-rate collapse on the broken one and stay high on the clean one. If it doesn’t collapse, I’m wrong and this tool is useless. It collapsed — 100% to 40% — and the detector named the exact segment. Run is below.
There’s even a name for the failure mode in the research now. The arXiv note Don’t Break the Cache (2601.06007, Lumer et al., Jan 2026) is entirely about prefix-stability discipline for cached agentic inference — worth a read if you want the formal treatment. The 70% default gate here is my own pick, not theirs: log your cached-token count, compute hits / (hits + full), and alert when it drops under ~70%. That number is a starting line, not a law — tune it to your own traces.
The tool: 40 lines, no API key, read-only
cache_break.py reads one JSONL trace. Each line is one agent step with a prefix: an ordered list of named segments (system, tool_defs, memory) — the part you expect to be cached. It does four deterministic things.
- Prefix-stability hash. Canonicalize each segment (
json.dumpswith sorted keys) and sha256 it. Lock the step-1 prefix as the baseline. - Break-point localization. For every step, compare segment hashes to the baseline. The first segment that diverges is the break point — the cache misses from there down, because everything after a changed byte re-bills as fresh.
- Hit-rate compute. Tokens above the break = cached; the break and everything below = fresh.
hit-rate = cached / (cached + fresh), summed across steps. tiktokeno200k_base, len/4 fallback if tiktoken’s missing. - Gate. Compare overall hit-rate to
--min-hit-rate(default 0.70). Below it or any cache-break detected → exit 1. This is a pre-execution gate: don’t ship a prompt ordering that punches through your own cache.
One honesty rule baked in: the output says source: estimated from prefix stability. If your trace carried real provider usage fields (Anthropic/OpenAI return cached-token counts), you’d use those instead and it’d say measured. I’m not dressing an estimate up as a meter reading.
#!/usr/bin/env python3
"""cache_break.py - measure prompt cache-hit-rate and localize cache-break in a JSONL trace."""
import json, hashlib, sys

MIN_HIT_RATE = 0.70       # my default gate: alert when cache-hit-rate drops below 70% (tune to your traces)
CACHE_READ = 0.30         # $/1M cached-read tokens  (public price flag, NOT a measurement)
FRESH = 3.00              # $/1M fresh-input tokens  (public price flag, NOT a measurement)

try:
    import tiktoken
    _enc = tiktoken.get_encoding("o200k_base")
    def count(t): return len(_enc.encode(t))
    TOKENIZER = "tiktoken o200k_base (exact)"
except Exception:                                  # honest fallback, ~+-15% vs real BPE
    def count(t): return max(1, round(len(t) / 4))
    TOKENIZER = "len/4 heuristic (tiktoken not installed; ~+-15%)"

def canon(seg): return hashlib.sha256(json.dumps(seg, sort_keys=True, ensure_ascii=False).encode()).hexdigest()[:12]

def main(argv):
    if len(argv) < 2:
        print("usage: cache_break.py <trace.jsonl> [--min-hit-rate 0.70]"); return 2
    min_hit = float(argv[argv.index("--min-hit-rate") + 1]) if "--min-hit-rate" in argv else MIN_HIT_RATE
    try:
        steps = [json.loads(ln) for ln in open(argv[1], encoding="utf-8") if ln.strip()]
        if not steps: raise ValueError("empty trace")
        base = [canon(s) for s in steps[0]["prefix"]]          # baseline prefix from step 1
        names = [s.get("name", f"seg{i}") for i, s in enumerate(steps[0]["prefix"])]
        toks = [count(json.dumps(s.get("text", s), ensure_ascii=False)) for s in steps[0]["prefix"]]
    except (KeyError, ValueError, json.JSONDecodeError, IndexError) as e:
        print(f"cache_break | BAD INPUT: {e}"); return 2

    cached, fresh, break_at, break_step = 0, 0, None, None
    for i, s in enumerate(steps):
        cur = [canon(seg) for seg in s["prefix"]]
        diff = next((j for j in range(min(len(base), len(cur))) if cur[j] != base[j]), None)
        if diff is None and len(cur) != len(base): diff = min(len(base), len(cur))
        if diff is None:                                       # whole prefix byte-identical -> all cached
            cached += sum(toks)
        else:                                                  # cache breaks at first divergence, rest re-bills fresh
            cached += sum(toks[:diff]); fresh += sum(toks[diff:])
            if break_at is None or diff < break_at:
                break_at, break_step = diff, i + 1

    hit = cached / (cached + fresh) if (cached + fresh) else 1.0
    broke = break_at is not None
    eff = CACHE_READ * hit + FRESH * (1 - hit)                 # blended $/1M on the prefix at this hit-rate

    print(f"cache_break | {argv[1]} | tokenizer: {TOKENIZER} | source: estimated from prefix stability")
    print("-" * 78)
    print(f"  steps={len(steps)}  prefix_segments={len(base)}  ({', '.join(names)})")
    print(f"  cached_tokens={cached}  fresh_tokens={fresh}")
    print(f"  cache_hit_rate     : {hit:.2%}   (threshold {min_hit:.0%})")
    if broke:
        print(f"  cache_break        : TRUE at segment {break_at} '{names[break_at] if break_at < len(names) else '?'}', first seen step {break_step}")
    else:
        print(f"  cache_break        : FALSE (prefix byte-identical across all steps)")
    print(f"  effective $/1M prefix : ${eff:.2f}  (vs ${CACHE_READ:.2f} all-cached / ${FRESH:.2f} all-fresh; public-price illustration)")
    rc = 0 if (hit >= min_hit and not broke) else 1
    print(f"  exit               : {rc}  ({'PASS' if rc == 0 else 'FAIL: hit-rate below threshold or cache_break'})")
    return rc

if __name__ == "__main__":
    sys.exit(main(sys.argv))
No key, no network, nothing written to disk. pip install tiktoken, point it at a trace, read the exit code. If tiktoken isn’t installed it falls back to len/4 and says so in the header (~±15% off real BPE). I’d rather print the caveat than fake the precision.
The real run
Two fixtures ship with it. Both are synthetic five-step coding sessions (no private data), same payments-svc task, same three-segment prefix: system, tool_defs, memory.
trace_clean.jsonl keeps that prefix byte-identical on every step — only the user tail changes, and the user tail isn’t part of the cached prefix. Actual output:
cache_break | fixtures/trace_clean.jsonl | tokenizer: tiktoken o200k_base (exact) | source: estimated from prefix stability
------------------------------------------------------------------------------
  steps=5  prefix_segments=3  (system, tool_defs, memory)
  cached_tokens=335  fresh_tokens=0
  cache_hit_rate     : 100.00%   (threshold 70%)
  cache_break        : FALSE (prefix byte-identical across all steps)
  effective $/1M prefix : $0.30  (vs $0.30 all-cached / $3.00 all-fresh; public-price illustration)
  exit               : 0  (PASS)
100% hit-rate, no break, exit 0. Green. The whole prefix rides the cache every step, effective price sits at the floor — $0.30/M.
trace_broken.jsonl is the exact same content, with one change: starting at step 3, the system segment carries a live clock — now=2026-06-21T08:14:03Z, a different value each step. That’s the only edit. Real output:
cache_break | fixtures/trace_broken.jsonl | tokenizer: tiktoken o200k_base (exact) | source: estimated from prefix stability
------------------------------------------------------------------------------
  steps=5  prefix_segments=3  (system, tool_defs, memory)
  cached_tokens=134  fresh_tokens=201
  cache_hit_rate     : 40.00%   (threshold 70%)
  cache_break        : TRUE at segment 0 'system', first seen step 3
  effective $/1M prefix : $1.92  (vs $0.30 all-cached / $3.00 all-fresh; public-price illustration)
  exit               : 1  (FAIL: hit-rate below threshold or cache_break)
40% hit-rate, exit 1. And it points at the culprit precisely: segment 0, system, first seen at step 3. Steps 1–2 cached fine; from step 3 on the timestamp lives at the very top of the prefix, so the cache misses on the system block and on the tool_defs and memory below it — even though those two never changed. That’s the cruel part of cache-break: damage at the top voids everything underneath. The blended price on this prefix went from $0.30 to $1.92/M, a 6.4x jump on this fixture, driven by one field a developer added to be helpful.
Watch the two numbers that prove it’s the timestamp and nothing else. Same payments-svc content. Same tool list. Same memory. Cached tokens fell 335 → 134; fresh went 0 → 201. The only delta in the input was a clock.
One more run worth showing, because it’s the design decision people argue with. A break is a gate condition on its own — not just a low rate. So even if you slacken the threshold all the way to 0.30, the broken trace still fails:
$ python3 cache_break.py fixtures/trace_broken.jsonl --min-hit-rate 0.30
  cache_hit_rate     : 40.00%   (threshold 30%)
  cache_break        : TRUE at segment 0 'system', first seen step 3
  exit               : 1  (FAIL: hit-rate below threshold or cache_break)
40% clears a 30% bar, but the break still trips exit 1. I made that call on purpose: a detected prefix-break means money is leaking somewhere measurable, and “the average is still okay” is exactly the reasoning that lets it leak for a month. Disagree with me on that — it’s a real design tradeoff, not a law.
Bad input is the third exit code. A malformed JSONL line returns exit 2, not a crash and not a false pass:
$ python3 cache_break.py fixtures/trace_bad.jsonl
cache_break | BAD INPUT: Expecting ',' delimiter: line 2 column 1 (char 82)
[exit 2]
Both real runs are reproducible. I hashed two consecutive clean runs and two consecutive broken runs with shasum -a 256; each pair was byte-identical (3608e4d5… for clean, fb72c110… for broken). Deterministic, not a one-shot fluke.
6.4x on my run, 10x at the ceiling — the honest version
You’ll see “10x” thrown around for cache breaks, so here’s where it comes from and what I actually got. The 10x is the unit gap: Anthropic’s published cached-read vs fresh-input ratio is roughly $0.30 to $3.00, a 10x difference on tokens that go from cached to fresh (Anthropic docs). That’s their public number, not mine.
What the tool computed on this fixture’s prefix was 6.4x — $0.30/M up to $1.92/M — because only 60% of the prefix tokens flipped to fresh, not all of them. If a break lands at segment 0 on step 1 of a long-running agent (the dynamic-timestamp case, which is the common one), every prefix token re-bills fresh and you approach the full 10x. So 10x is the ceiling from public prices; 6.4x is the real, smaller, honestly-labeled number from my run. I’d rather you trust the 6.4x I can show you than the 10x I can’t.
This is the same shape as the context tax, but a different leak. There, you re-bill the whole transcript every step because it grows — a meter, not a guard. Here the prefix is supposed to be free-ish via cache, and a one-byte change quietly un-frees it. Different axis, different number, same lesson: measure the thing, don’t assume the feature did its job.
Where this fits
The prefix this tool watches — the long, stable system + tool definitions + memory block — is the same one I metered for raw cost in your MCP server’s token tax. Token-tax asks “how big is this prefix”; cache-break asks “are you actually paying the cached price for it, or silently the fresh one.” Run both on the same trace and you’ve covered both halves: the size of the prefix and whether it’s hitting cache.
And it’s the same philosophy as the pre-execution gate: catch the broken prompt ordering before you ship it, fail the build, not after the invoice. Cache-break is a perfect CI gate because it’s deterministic — same trace, same verdict, every time. If you want the runtime spend brake instead of a structural check, that’s the sliding-window spend guard, which caps cumulative cost over a window rather than auditing prefix stability.
What this is NOT (so I don’t oversell it)
- It does not read your provider’s real cached-token counts unless you put them in the trace. The hit-rate here is estimated from prefix stability — it assumes the cache misses from the first changed byte down, which is how prefix caching works, but it’s a structural model, not a meter reading off your bill. If your trace carries real
usagefields, wire those in and trust those instead. The header tells you which mode you’re in. - It does not compute your invoice. The
$/Mfigures use Anthropic’s public $0.30/$3.00 prices as a flag, to illustrate the cached-vs-fresh gap. Your real bill depends on cache TTL, minimum cacheable length, output tokens, and your vendor — none of which this models. - It does not account for cache expiry. A prefix can be byte-identical and still miss because the cache entry aged out (Anthropic’s default TTL is short). This tool catches the structural break — a changed prefix — not a timed-out one. Those need provider usage data to see.
- It assumes you’ve segmented your prefix in the trace (system / tool_defs / memory). Garbage segmentation in, vague break-point out. The localization is only as precise as your segments — a one-character edit inside the
systemblock re-bills the wholesystemsegment as fresh here, even though a real tokenizer would only lose the tokens from that character down. So I say “from the first changed byte down” as the model, but the tool resolves it at the segment boundary, not the byte. That makes it slightly pessimistic on mid-segment edits, never optimistic. - It does not charge the cache-write premium. Anthropic bills a cache write at ~1.25x base input, so the very first step (and every step that re-breaks the cache) pays more than the fresh-input number, not less. The “$0.30 all-cached floor” is the steady-state read price, not an achievable per-run average — which means a repeatedly-broken cache costs a bit more than the $1.92 here suggests, not less. I left write-cost out to keep the model simple; it only ever understates the leak.
What’s the dumbest thing that’s broken your prompt cache — a timestamp, a reordered tool list, a uuid someone logged into the system prompt? Run the detector on a real trace and tell me where it pointed. I’m collecting break points, and I read every reply. Follow for the next number from the next run.